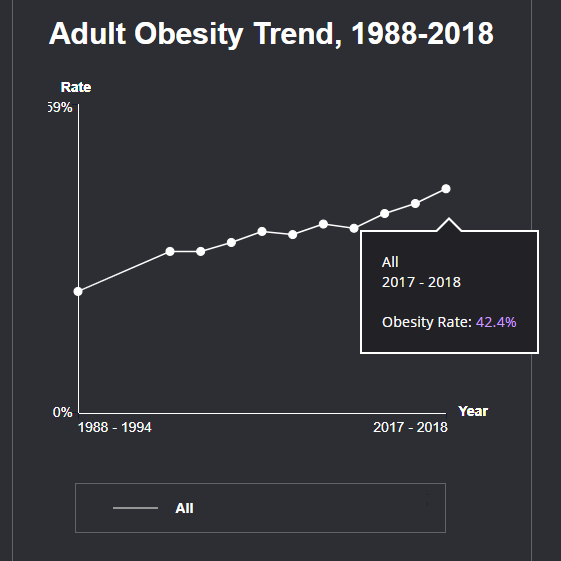
Nebraska
In Nebraska, 11.5% of youth ages 10 to 17 have obesity, giving Nebraska a ranking of 43 among the 50 states and D.C. This page includes Nebraska data in four areas: the latest data on obesity, diabetes, and hypertension; how federal nutrition policies impact Nebraska; health behaviors and outcomes among high school students; and policies enacted by Nebraska health and prevent obesity.

Rates, Ranks, and Trends
Several federal datasets provide the latest health information for children, adolescents, and adults. Below are the current obesity rates among various age groups, the diabetes and hypertension rates for adults, rankings among all states, and trends over time.
Childhood Nutrition Data
National programs and policies can make it easier for children to access healthier foods and beverages. The number of children participating in each of these programs varies from state to state. See participation numbers and rates below, or visit the full interactive feature.
Supplemental Nutrition Assistance Program (SNAP)
152,869
Nebraska Number of residents participating in in 2020.
80% Percentage of eligible residents participating in 2016.
Supplemental Nutrition Assistance Program (SNAP) -- Children
81,000
Nebraska Number of participating residents who are children in in 2018.
48.9% Percentage of participants who are children in 2018.
Supplemental Nutrition Assistance Program (SNAP) - White
56.7%
Nebraska Percentage of participating households where the head of household is White in in 2018.
Supplemental Nutrition Assistance Program (SNAP) - African-American
17.30%
Nebraska Percentage of participating households where the head of household is African-American in in 2018.
Supplemental Nutrition Assistance Program (SNAP) - Hispanic
5.0%
Nebraska Percentage of participating households where the head of household is Hispanic in in 2018.
Summer Food Service Program (SFSP)
10,559
Nebraska Number of students participating in in 2019.
Head Start
3,274
Nebraska Number of children participating in in 2019.
24% Percentage of eligible children participating in 2019.
Women, Infants, and Children (WIC)
33,983
Nebraska Number of residents participating in in 2019.
52.8% Percentage of eligible residents participating in 2016.
Child and Adult Care Food Program (CACFP)
38,389
Nebraska Number of students participating, by state in CACFP in 2019.
21,213,233 Total meals served annually in 2019.
National School Lunch Program (NSLP)
242,708
Nebraska Number of children participating in in 2019.
44.7% Percentage of students eligible for free/reduced-price lunch in 2016-17.
Food Insecurity (CFI)
12%
Nebraska Percentage of children who are food insecure in CFI in 2018.
High Schooler Health Data
The Youth Risk Behavior Surveillance System (YRBSS) surveys high school students to better understand a variety of health issues and behaviors. This feature includes data related to obesity, nutrition, and physical activity.
Visit full interactive with data on nutrition behaviors among high school students
Visit full interactive with data on physical activity behaviors among high school students
Low P.E. Participation
Physically active at least 60 minutes
High Computer Usage
High TV Watching
High Soda Consumption
No Breakfast
Low Fruit Consumption
Low Vegetable Consumption
State Policy Data
In addition to federal policies, states have many of their own policies to make it easier for children to grow up healthy. Below is a selection of policies some states have enacted to support health.