Alabama
Alaska
Arizona
Arkansas
California
Colorado
Connecticut
Delaware
District of Columbia
Florida
Georgia
Hawaii
Idaho
Illinois
Indiana
Iowa
Kansas
Kentucky
Louisiana
Maine
Maryland
Massachusetts
Michigan
Minnesota
Mississippi
Missouri
Montana
Nebraska
Nevada
New Hampshire
New Jersey
New Mexico
New York
North Carolina
North Dakota
Ohio
Okalahoma
Oregon
Pennslyvania
Rhode Island
South Carolina
South Dakota
Tennessee
Texas
Utah
Vermont
Virginia
Washington
West Virginia
Wisconsin
Wyoming
Explore State Data
Georgia
In Georgia, 16.6% of youth ages 6 to 17 have obesity, giving Georgia a ranking of 20 among the 50 states and D.C. This page includes Georgia data in four areas: the latest data on obesity, diabetes, and hypertension; how federal nutrition policies impact Georgia; health behaviors and outcomes among high school students; and policies enacted by Georgia to support health and prevent obesity.

Rates, Ranks, and Trends
Several federal datasets provide the latest health information for children, adolescents, and adults. Below are the current obesity rates among various age groups, the diabetes and hypertension rates for adults, rankings among all states, and trends over time.
12.9%
Obesity Rate
37 of 51 Georgia rank
16.6%
Obesity Rate
20 of 51 Georgia rank
18.3%
Obesity Rate
7 of 51 Georgia rank
35.4%
Obesity Rate
19 of 51 Georgia rank
12%
Obesity Rate
14 of 51 Georgia rank
34.8%
Obesity Rate
14 of 51 Georgia rank
Childhood Nutrition Data
National programs and policies can make it easier for children to access healthier foods and beverages. The number of children participating in each of these programs varies from state to state. See participation numbers and rates below, or visit the full interactive feature.
Supplemental Nutrition Assistance Program (SNAP)
1,709,000
Georgia SNAP: Number of people eligible in SNAP in FY 2020* Because the Coronavirus COVID-19 public health emergency affected data collection starting in March 2020, this summary covers only the pre-pandemic period of October 2019 through February 2020.
72% SNAP: Percentage of elgible people who participated in FY 2020*.
Supplemental Nutrition Assistance Program (SNAP) -- Children
586,000
Georgia SNAP Participation: Number Children in SNAP in FY 2020* Because the Coronavirus COVID-19 public health emergency affected data collection starting in March 2020, this summary covers only the pre-pandemic period of October 2019 through February 2020.
46.10% SNAP Participation: Percent Children in FY 2020* Because the Coronavirus COVID-19 public health emergency affected data collection starting in March 2020, this summary covers only the pre-pandemic period of October 2019 through February 2020.
Supplemental Nutrition Assistance Program (SNAP) - White
33.80%
Georgia SNAP Participation: White SNAP-White head of household in FY 2020* Because the Coronavirus COVID-19 public health emergency affected data collection starting in March 2020, this summary covers only the pre-pandemic period of October 2019 through February 2020.
Supplemental Nutrition Assistance Program (SNAP) - African-American
59.40%
Georgia SNAP Participation: African American SNAP-African-American head of household in FY 2020* Because the Coronavirus COVID-19 public health emergency affected data collection starting in March 2020, this summary covers only the pre-pandemic period of October 2019 through February 2020.
Supplemental Nutrition Assistance Program (SNAP) - Hispanic
1.00%
Georgia SNAP Participation: Hispanic SNAP-Hispanic head of household in FY 2020* Because the Coronavirus COVID-19 public health emergency affected data collection starting in March 2020, this summary covers only the pre-pandemic period of October 2019 through February 2020.
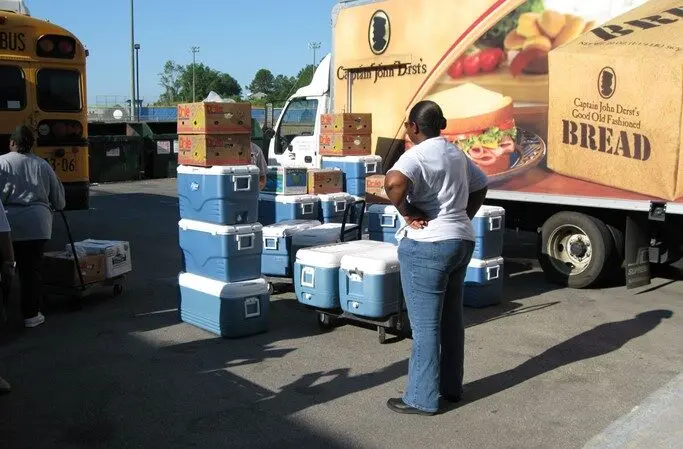
Summer Food Service Program (SFSP)
49,202
Georgia Summer Food Service Program: Average Daily Attendance SFSP in FY 2023.
Head Start
23,771
Georgia Head Start - total number of funded slots in Head Start in FY 2023.
25% Head Start - percentage of eligibile children ages 3-5 who had access to a slot in 2020.
Women, Infants, and Children (WIC)
232,313
Georgia Women, Infants, and Children Program: Total Participation in WIC in FY 2023.
40.6% Women, Infants, and Children Program: Coverage Rates in 2020.
Child and Adult Care Food Program (CACFP)
128,554
Georgia Child and Adult Care Food Prgram: Average Daily Attendance in CACFP in FY 2023 Preliminary.
69,522,798 Child and Adult Care Food Program: Total Meals Served in FY 2023 Preliminary.
National School Lunch Program (NSLP)
59.60%
Georgia Percentage of public school students eligible for free or reduced-price lunch in NSLP in 2022-2023.
59.7% Percentage of students eligible for free/reduced-price lunch in 2019-2020.
Food Insecurity (CFI)
18.40%
Georgia Rate of Food Insecurity among Child (<18 years) Population in the United States in CFI in 2022.
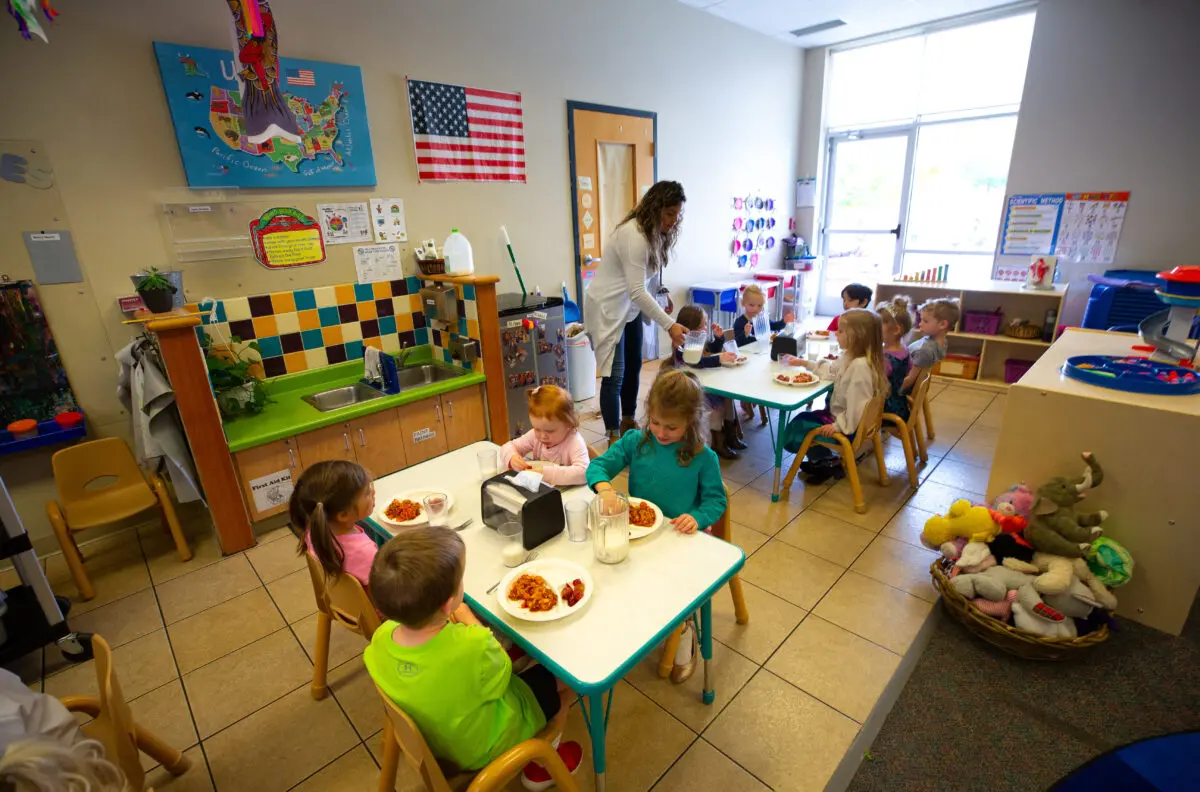
High Schooler Health Data
The Youth Risk Behavior Surveillance System (YRBSS) surveys high school students to better understand a variety of health issues and behaviors. This feature includes data related to obesity, nutrition, and physical activity.
Visit full interactive with data on nutrition behaviors among high school students
Visit full interactive with data on physical activity behaviors among high school students
Low P.E. Participation
62.1%
62.1%
Physically active at least 60 minutes
76.8%
76.8%
High Computer Usage
0%
0%
High TV Watching
0%
0%
High Soda Consumption
0%
0%
No Breakfast
22.9%
22.9%
Low Fruit Consumption
9.9%
9.9%
Low Vegetable Consumption
9.9%
9.9%

Community Story
Will School Meals for All End This Summer?
Community Story
Summer Meals Help Students Eat Healthy in Burke County, Georgia

Community Story